Every executive appreciates a dashboard showing 99.99% uptime, yet experienced infrastructure professionals understand that availability percentages reveal only a fraction of the operational story. An organization may proudly advertise exceptional uptime while simultaneously fighting recurring hardware failures, slow incident response, inconsistent repair procedures, aging equipment, and operational processes that become increasingly fragile as the environment grows. From the outside, customers see a healthy infrastructure. Inside the data center, however, engineers may be spending countless hours reacting to the same preventable issues over and over again.
Eventually that hidden operational debt surfaces as extended outages, delayed deployments, frustrated customers, and infrastructure costs that rise much faster than anyone expected. The lesson is straightforward: uptime measures outcomes, while reliability measures the quality of the processes producing those outcomes. Companies that recognize this distinction early generally spend less on emergency repairs, experience fewer business interruptions, and build infrastructure that continues supporting growth long after less disciplined organizations begin replacing hardware simply because confidence has eroded.
As infrastructure environments become increasingly distributed across multiple data centers, virtualization platforms, storage clusters, GPU compute farms, hybrid cloud deployments, and geographically diverse disaster recovery sites, measuring reliability becomes considerably more complex than checking whether a server responded to a monitoring probe. Today’s enterprise infrastructure resembles an interconnected ecosystem where failures often cascade across multiple systems before users ever notice an interruption. A failing RAID controller may initially appear to be nothing more than a storage alert, but it can quickly affect database latency, virtual machine performance, backup completion windows, application response times, customer satisfaction, and ultimately business revenue.
Likewise, an overloaded network switch may create intermittent packet loss that produces application instability long before a complete outage occurs. Looking only at uptime percentages ignores these developing conditions, much like judging the health of an automobile solely by whether it starts each morning while overlooking worn brakes, failing bearings, or leaking fluids that eventually produce far more serious problems.
This shift in thinking has become especially important because executive leadership no longer views infrastructure simply as a technical necessity. Modern organizations increasingly recognize their technology platforms as business assets that directly influence customer retention, regulatory compliance, operational efficiency, employee productivity, cybersecurity resilience, and competitive advantage. Boards of directors rarely ask whether a particular server remained online yesterday afternoon. Instead, they ask whether the organization is reducing operational risk, protecting revenue, and investing capital wisely. Those questions require measurements capable of demonstrating long-term operational maturity rather than isolated snapshots of availability. Consequently, infrastructure teams that continue reporting only uptime often struggle to justify hardware refreshes, staffing increases, monitoring investments, or documentation initiatives because executives cannot easily connect those expenditures to measurable improvements in business reliability.
The organizations consistently outperforming their competitors tend to approach infrastructure through a different lens altogether. Rather than asking whether failures occurred, they ask why failures occurred, how frequently similar incidents appear, how long recovery required, whether response procedures are improving over time, and which investments produce measurable reductions in operational risk. These organizations recognize that failures themselves are inevitable. Hard drives wear out. Memory modules eventually fail. Firmware occasionally introduces defects. Power supplies reach the end of their service life. Network equipment requires replacement. The objective is not to eliminate every possible failure as that goal is unrealistic, but to understand failure behavior so thoroughly that infrastructure becomes increasingly predictable, easier to maintain, less expensive to operate, and substantially more resilient as the business grows. Predictability, perhaps more than any other characteristic, separates mature infrastructure organizations from those that spend their days reacting to unexpected emergencies.
Executive Summary
Infrastructure reliability should never be evaluated solely through uptime percentages because availability alone cannot explain whether an environment is becoming healthier or simply fortunate. A platform may experience relatively few outages while underlying operational weaknesses continue accumulating unnoticed. Aging hardware, inconsistent documentation, slow incident acknowledgment, inadequate monitoring, delayed replacement parts, fragmented support procedures, or insufficient staffing rarely appear in an uptime report, yet each contributes significantly to future business risk. Organizations that rely exclusively on availability metrics often discover these weaknesses only after a major outage exposes years of unnoticed operational debt.
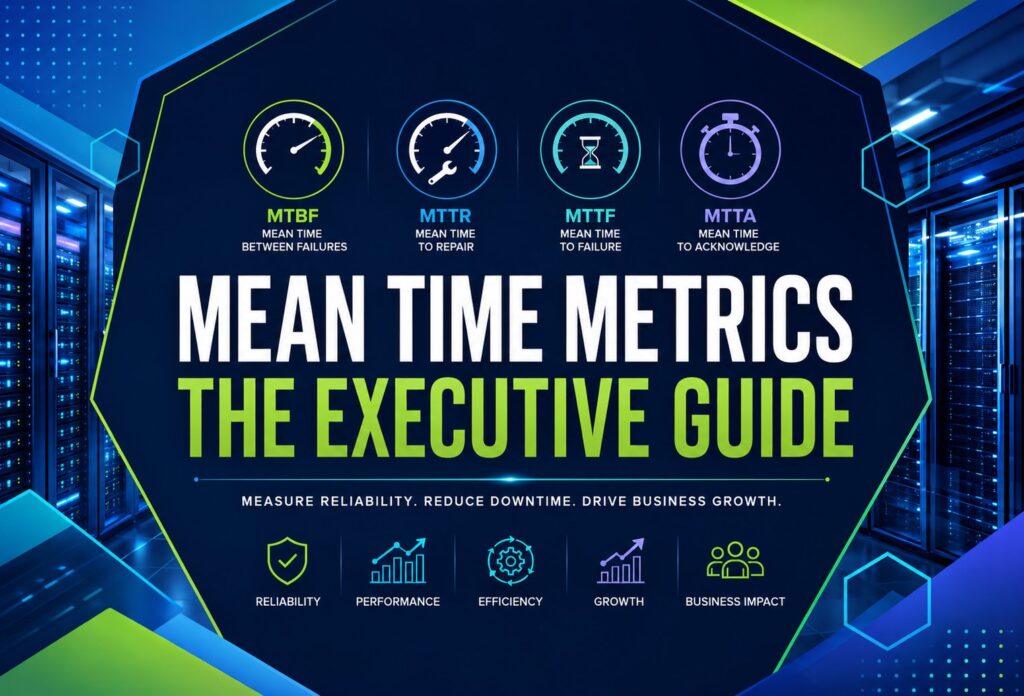
This is precisely why Mean Time Between Failures (MTBF), Mean Time To Repair (MTTR), Mean Time To Failure (MTTF), and Mean Time To Acknowledge (MTTA) have become essential measurements for enterprise infrastructure management. Individually, each metric answers a different operational question. Together, they provide an exceptionally clear picture of infrastructure reliability by revealing how frequently failures occur, how rapidly incidents are detected, how efficiently engineering teams restore service, and whether long-term operational improvements are genuinely reducing business risk. Instead of making procurement decisions based on assumptions or replacing equipment according to arbitrary calendar schedules, organizations can prioritize investments using measurable evidence collected from actual production environments.
These metrics also improve communication between technology leadership and executive management because they translate technical performance into business language. Finance departments gain measurable justification for capital expenditures. Operations teams identify recurring process inefficiencies before they become major outages. Procurement personnel evaluate vendors using long-term operational performance rather than purchase price alone. Executive leadership gains confidence that infrastructure investments are reducing operational exposure rather than merely increasing technology spending. Over time, this creates a continuous improvement cycle where every incident contributes meaningful operational intelligence instead of simply becoming another help desk ticket that disappears after service has been restored.
Organizations pursuing long-term infrastructure maturity may also benefit from reading our companion article, How to Design Infrastructure for Five Years of Business Growth, which examines strategic planning well beyond today’s operational requirements: . Likewise, readers interested in strengthening procurement decisions should review How to Evaluate Dedicated Server Providers Beyond Price, while those focused on operational efficiency may find additional value in How to Measure Infrastructure Efficiency Instead of Just Server Utilization. Two additional resources that complement this discussion include How to Build a Hardware Lifecycle Replacement Policy That Finance and IT Both Support and How to Create Infrastructure Procurement Standards That Prevent Costly Purchasing Mistakes, both of which demonstrate how reliability metrics influence purchasing decisions throughout the hardware lifecycle. Organizations evaluating new production infrastructure can also explore ProlimeHost’s Dedicated Server Hosting solutions and GPU Dedicated Servers for AI, rendering, and high-performance computing workloads, where enterprise-grade platforms provide the operational consistency required for meaningful long-term reliability measurement.
Why Reliability Is Becoming the Executive Metric That Matters
There was a time when measuring infrastructure performance was relatively straightforward because environments themselves were comparatively simple. A handful of physical servers hosted business applications, storage systems operated independently, backup windows occurred overnight, and disaster recovery often consisted of tape rotations stored offsite. Under those conditions, uptime percentages provided a reasonably accurate representation of operational performance because relatively few moving parts existed. Today’s enterprise environments bear little resemblance to that model. Virtualization platforms host hundreds or thousands of workloads across clustered infrastructure. Storage arrays span multiple controllers and replication sites. AI environments rely on GPU clusters operating continuously under significant thermal and computational loads. Applications frequently depend upon numerous interconnected services, APIs, databases, and external providers, meaning a seemingly isolated hardware fault can ripple across multiple business functions within minutes.
As complexity increases, so does the importance of understanding not merely whether systems remain available, but how consistently operational processes support that availability. Consider two organizations reporting identical uptime over a twelve-month period. The first experiences only a handful of isolated component failures, each detected within seconds by sophisticated monitoring systems, acknowledged immediately by engineering staff, and resolved through documented procedures supported by readily available replacement hardware. The second organization reaches the same uptime percentage despite suffering recurring storage failures, inconsistent incident escalation, delayed response times, incomplete documentation, and repeated emergency maintenance windows requiring extensive manual intervention. From a purely numerical availability perspective, the two organizations appear nearly identical. Operationally, however, they occupy entirely different levels of maturity, resilience, and long-term business risk.
This distinction explains why leading infrastructure organizations increasingly emphasize mean time metrics rather than relying exclusively upon uptime reporting. These measurements transform isolated technical incidents into meaningful operational intelligence that executives, financial planners, procurement specialists, and engineering teams can all understand. Patterns begin emerging that would otherwise remain invisible. Vendors demonstrating consistently higher failure rates become identifiable. Documentation deficiencies reveal themselves through extended repair times. Staffing shortages become measurable through increasing acknowledgment delays. Aging hardware can be replaced according to objective operational evidence instead of arbitrary depreciation schedules. Perhaps most importantly, organizations develop the ability to forecast reliability improvements before they occur rather than simply explaining outages after the fact.
This evolution represents a significant shift in how infrastructure should be managed. Rather than viewing servers as isolated technical assets, organizations begin managing reliability as a measurable business capability. Decisions become increasingly evidence-based, capital investments align more closely with operational outcomes, and infrastructure gradually transforms from a reactive cost center into a strategic asset supporting sustainable business growth. That transformation begins with understanding the individual mean time metrics themselves, because each provides a different perspective on infrastructure health. When combined, they form a remarkably accurate framework for evaluating operational reliability from both technical and executive perspectives.
Understanding the Mean Time Metrics That Reveal Infrastructure Health
One of the more interesting observations made by experienced infrastructure leaders is that no single reliability metric ever tells the complete story. Organizations occasionally become fixated on improving one measurement while unintentionally allowing another to deteriorate, creating the illusion of progress without actually improving operational resilience. An engineering team may dramatically reduce repair times through better automation, yet if failures begin occurring twice as frequently because aging hardware continues to remain in production, overall reliability has not improved. Likewise, purchasing exceptionally reliable enterprise hardware offers only limited value if incident detection remains slow or support procedures require hours before meaningful troubleshooting even begins. The real strength of mean time metrics lies not in their individual values but in the relationships they share with one another. When evaluated collectively over months and years rather than isolated reporting periods, these measurements begin exposing operational patterns that would otherwise remain invisible.
Perhaps even more importantly, these metrics encourage organizations to think systemically rather than reactively. Every infrastructure failure has multiple stages. Something fails. Someone eventually notices. Engineers acknowledge the incident. Investigation begins. Repairs are completed. Systems return to service. Preventive actions are or unfortunately are not implemented afterward. Each stage introduces opportunities for improvement, and each stage has a corresponding metric that measures how effectively the organization performs. Rather than simply documenting outages for compliance purposes, mature IT organizations use these measurements to understand how operational processes evolve over time. Improvements become measurable, deficiencies become difficult to ignore, and discussions with executive leadership shift from anecdotal explanations toward objective operational evidence.
Mean Time Between Failures (MTBF): Measuring Operational Stability
Among all reliability measurements, Mean Time Between Failures (MTBF) remains one of the most widely recognized because it directly reflects operational stability. Simply stated, MTBF measures the average amount of productive operating time between one repairable failure and the next. A higher MTBF generally indicates that equipment, software, or entire infrastructure platforms operate reliably for longer periods before experiencing another interruption requiring corrective action.
What makes MTBF particularly valuable is that it reveals long-term trends rather than isolated incidents. One failed power supply tells very little about the health of an environment. A steadily declining MTBF across multiple server platforms, however, often signals much larger operational concerns. Aging hardware fleets, inconsistent firmware management, inadequate preventive maintenance, poor environmental conditions, manufacturing defects, or inappropriate workload placement frequently become apparent months before major service disruptions occur. Organizations monitoring MTBF consistently often recognize deteriorating infrastructure well before customers notice declining service quality.
It is equally important, however, to avoid misinterpreting MTBF as a prediction. Engineers occasionally assume that a server with a calculated MTBF of four years should reliably operate exactly four years before failure. That is not how the metric works. MTBF is an average derived from historical observations across comparable equipment or operational environments. Individual components may fail much sooner or continue operating well beyond calculated averages. Consequently, MTBF should be viewed as a strategic planning measurement rather than a maintenance calendar. Used correctly, it helps organizations determine when hardware refresh cycles deserve reevaluation, whether procurement standards are producing dependable infrastructure, and which vendors consistently deliver higher operational reliability over extended deployment periods.
An organization that integrates MTBF into procurement discussions frequently begins asking more sophisticated questions. Which storage platforms demonstrate longer operational life under comparable workloads? Does one server platform consistently outperform another after three years of production use? Are newer processor generations introducing unexpected reliability concerns despite improved performance? Instead of evaluating infrastructure solely by acquisition cost, leadership begins considering long-term operational value, an approach explored further in our article How to Create Infrastructure Procurement Standards That Prevent Costly Purchasing Mistakes. Procurement decisions gradually become less transactional and far more strategic.
Mean Time To Repair (MTTR): Measuring Operational Recovery
If MTBF answers how often failures occur, Mean Time To Repair (MTTR) answers an equally important question: how efficiently can the organization restore normal operations after failure occurs? This metric measures the average elapsed time required to diagnose an incident, complete repairs, validate successful restoration, and return production services to normal operating conditions. Unlike MTBF, which reflects equipment reliability, MTTR primarily evaluates organizational capability.
That distinction cannot be overstated. An organization may own exceptionally reliable infrastructure while still demonstrating poor operational maturity if incident response remains slow and inconsistent. Conversely, even complex enterprise environments occasionally experience hardware failures, but mature engineering teams often restore service so rapidly that business disruption remains minimal. MTTR therefore reflects much more than technical expertise. It incorporates documentation quality, monitoring effectiveness, spare parts availability, escalation procedures, change management, automation, communication between teams, vendor responsiveness, and even organizational culture.
Imagine two identical storage arrays suffering the same controller failure. In one environment, automated monitoring identifies the fault within seconds, documented procedures guide engineers through replacement, spare hardware is already stocked within the facility, and production workloads resume within twenty minutes. In the second environment, alerts are overlooked because notification thresholds were never updated, documentation exists only within a senior engineer’s memory, replacement hardware must be ordered overnight, and multiple departments spend hours coordinating recovery activities. The underlying hardware failure was identical. The resulting MTTR and the business impact could not be more different.
Organizations committed to reducing MTTR generally discover that technology alone rarely produces meaningful improvement. Investments in operational documentation, standardized infrastructure, cross-training, automated provisioning, proactive monitoring, and disciplined change control often reduce recovery times more dramatically than purchasing faster hardware. This concept closely aligns with our article How to Build an Infrastructure Documentation Strategy That Survives Staff Turnover, because documentation quality directly influences recovery efficiency during high-pressure incidents when every minute matters.
Mean Time To Failure (MTTF): Understanding Non-Repairable Assets
Although often confused with MTBF, Mean Time To Failure (MTTF) serves a different purpose because it measures the expected operational lifespan of non-repairable components. Rather than evaluating intervals between repairs, MTTF estimates the average operating time before an asset permanently reaches the end of its useful life. Traditional examples include certain solid-state components, batteries, optical modules, disposable networking equipment, and other hardware intended for replacement rather than repair.
In practice, MTTF provides tremendous value for lifecycle planning because it allows organizations to anticipate replacement schedules before widespread failures begin disrupting production. When combined with inventory management, warranty tracking, and procurement forecasting, MTTF helps infrastructure teams transition from reactive replacement toward planned lifecycle management. Unexpected outages decline because organizations replace aging components proactively instead of waiting for inevitable failure.
Financial leadership often appreciates MTTF for another reason entirely. Planned replacement schedules generally cost far less than emergency procurement. Budget forecasting becomes more accurate, supply chain disruptions have less operational impact, and maintenance windows can be coordinated alongside broader infrastructure initiatives. This philosophy forms the foundation of our article How to Build a Hardware Lifecycle Replacement Policy That Finance and IT Both Support, where infrastructure investments become aligned with measurable operational evidence rather than arbitrary depreciation schedules.
Mean Time To Acknowledge (MTTA): Measuring Organizational Awareness
Perhaps the most underestimated reliability metric is Mean Time To Acknowledge (MTTA). While organizations frequently invest significant resources reducing repair times, many overlook the interval before engineers even recognize that a problem exists. MTTA measures precisely that period, the average time between incident occurrence and formal acknowledgment by the responsible operations team.
At first glance, a few additional minutes may appear insignificant. In reality, delayed acknowledgment often amplifies every other operational metric. A storage failure left unnoticed for fifteen minutes may quickly evolve into database corruption. Network congestion ignored during peak traffic may cascade into application failures affecting thousands of users. Cooling alarms that remain unacknowledged can rapidly escalate into hardware damage requiring days rather than minutes of recovery. In other words, poor MTTA frequently causes poor MTTR, regardless of engineering skill.
Reducing MTTA depends heavily upon monitoring maturity. Intelligent alert correlation, automated escalation policies, clearly defined ownership, twenty-four-hour operational visibility, and carefully maintained monitoring platforms all contribute to faster acknowledgment times. Organizations frequently discover that improving MTTA delivers disproportionately large improvements across overall infrastructure reliability because incidents begin receiving attention before secondary failures emerge. It is one of the clearest examples of how relatively modest operational investments can produce substantial reductions in business risk.
Why the Metrics Must Be Viewed Together
Evaluating any one of these measurements independently provides useful information, but meaningful executive insight emerges only when they are interpreted collectively. An improving MTBF accompanied by worsening MTTR suggests equipment reliability is increasing while operational response procedures are deteriorating. A declining MTTA combined with stable MTTR may indicate monitoring improvements without corresponding gains in repair efficiency. Increasing MTTF values may justify extending lifecycle policies, whereas declining MTBF across specific hardware families may support accelerated replacement despite remaining warranty coverage.
Seen together, these relationships transform isolated operational statistics into a comprehensive reliability framework. Executives gain objective evidence supporting infrastructure investment decisions. Engineering teams identify where process improvements will produce the greatest operational benefit. Finance departments connect capital expenditures with measurable reductions in business risk rather than viewing infrastructure simply as another technology expense. Reliability, in other words, becomes something the organization actively manages instead of something it merely hopes to achieve.
That broader perspective ultimately changes how infrastructure strategy is developed. Rather than reacting to individual outages, organizations begin improving the systems, procedures, and decision-making processes that determine whether future outages occur at all. In the next section, we will examine how leading enterprises combine these metrics into executive dashboards, procurement strategies, service-level objectives, and long-term infrastructure planning models that steadily improve operational resilience year after year.
Why Organizations Frequently Misuse Mean Time Metrics
One of the more surprising realities of infrastructure management is that many organizations collect mean time metrics for years without ever transforming the information into better operational decisions. Dashboards become increasingly sophisticated, monthly reports become more visually appealing, and management meetings become filled with graphs illustrating historical performance, yet very little actually changes. The measurements exist, but they remain disconnected from procurement decisions, staffing models, infrastructure standards, lifecycle planning, and executive strategy. In those environments, metrics become historical records rather than management tools. They explain what happened after an outage instead of helping prevent the next one.
One common mistake is evaluating each metric independently rather than recognizing that they influence one another continuously. A steadily improving MTTR may appear encouraging until leadership notices that MTBF has simultaneously declined because aging hardware continues failing more frequently. Likewise, extending hardware replacement cycles may initially reduce capital expenditures, but those savings often disappear once declining MTBF and increasing MTTR begin generating higher support costs, emergency maintenance, customer disruptions, and lost productivity. Looking at individual measurements in isolation can therefore produce decisions that appear financially responsible while quietly increasing operational risk.
Another frequent mistake involves measuring averages without understanding distribution. Imagine two organizations reporting an MTTR of one hour. At first glance, both appear equally efficient. However, one organization may consistently restore service within fifty to seventy minutes, while the other resolves most incidents within fifteen minutes but occasionally requires eight or ten hours because documentation is incomplete or replacement hardware is unavailable. The averages are identical, yet the operational predictability differs dramatically. Executive leadership generally values consistency almost as much as speed because predictable operations simplify budgeting, customer communication, staffing, maintenance scheduling, and contractual service commitments.
There is also a tendency to celebrate improving metrics without asking what actually caused the improvement. Did MTTR decrease because engineers became more efficient, or because incidents were less severe? Did MTBF improve because hardware quality increased, or simply because fewer production systems were monitored? Reliability measurements should always prompt deeper questions rather than provide automatic reassurance. Mature infrastructure organizations continually investigate the operational behaviors behind every meaningful trend because sustainable improvement rarely occurs by accident.
Connecting Mean Time Metrics to Service Level Objectives
While Service Level Agreements (SLAs) define contractual commitments to customers, Service Level Objectives (SLOs) establish the internal operational targets that make those commitments achievable. This distinction becomes increasingly important as organizations grow because customer expectations are ultimately fulfilled or missed through operational discipline rather than contractual language. Mean time metrics provide the quantitative foundation upon which meaningful SLOs are built.
Consider an organization promising customers 99.99 percent availability. That commitment immediately raises several operational questions. How quickly must incidents be acknowledged? What recovery time is acceptable before contractual obligations become jeopardized? How frequently can failures occur before availability targets become mathematically impossible to maintain? Without measurable answers to those questions, availability objectives remain aspirational rather than operational.
When organizations begin integrating MTBF, MTTR, MTTF, and MTTA into their SLO framework, operational planning becomes considerably more disciplined. Engineering teams understand precisely which improvements will have the greatest effect on customer experience. Procurement departments recognize why investing in higher-quality infrastructure often produces greater long-term value than selecting the lowest acquisition cost. Executive leadership gains confidence that operational targets are supported by measurable engineering capability instead of optimistic assumptions. Reliability therefore becomes something intentionally engineered rather than merely reported.
This philosophy closely complements our earlier discussion in How to Create Infrastructure KPIs That Matter to Executives, where the emphasis shifts from technical reporting toward business outcomes that executive leadership can evaluate confidently.
Using Reliability Metrics to Evaluate Infrastructure Providers
Organizations frequently compare infrastructure providers using monthly pricing, processor specifications, memory capacity, storage configurations, and bandwidth allocations. While those characteristics certainly deserve consideration, they reveal remarkably little about the provider’s long-term operational reliability. Two providers offering nearly identical hardware may deliver dramatically different customer experiences because their operational maturity differs in ways not immediately visible on a product page.
This is where mean time metrics become valuable evaluation tools. Prospective customers should not hesitate to ask providers about hardware refresh policies, spare component inventories, monitoring capabilities, incident response procedures, engineering availability, documentation standards, maintenance practices, and escalation workflows. Even when providers do not publish MTBF or MTTR figures directly, their operational practices often indicate whether reliability engineering forms part of their culture or whether support remains largely reactive.
For example, does the provider proactively replace aging enterprise drives before failure rates begin climbing? Are redundant components stocked locally within each data center? Is infrastructure monitored continuously by engineering personnel, or only after customers report problems? Does the organization standardize hardware platforms to simplify maintenance and spare part management? These operational characteristics frequently influence real-world reliability far more than modest differences in processor performance or monthly pricing.
Organizations evaluating new infrastructure deployments may wish to review ProlimeHost’s Dedicated Server Hosting solutions, where standardized enterprise platforms, proactive infrastructure management, and carefully selected hardware contribute to long-term operational consistency. Businesses deploying artificial intelligence, large-scale rendering, scientific computing, or GPU-intensive analytics can likewise explore ProlimeHost’s GPU Dedicated Servers, where reliability becomes especially critical because GPU workloads often operate continuously under sustained computational demand.
How Mean Time Metrics Improve Procurement Decisions
Infrastructure procurement has traditionally emphasized specifications. Processor generations, memory capacity, storage performance, and network throughput understandably dominate purchasing discussions because they are easy to compare objectively. Yet organizations focusing exclusively on specifications often discover that operational performance depends just as much upon reliability characteristics as raw computing power.
Suppose two server platforms appear nearly identical from a technical perspective. One platform costs slightly less but demonstrates declining MTBF after three years of production use. The second platform requires a somewhat larger capital investment but consistently delivers longer operational life, fewer emergency maintenance events, and lower repair frequency throughout its deployment. Evaluated solely through acquisition cost, the first option appears attractive. Evaluated through long-term reliability metrics, however, the second platform may produce significantly lower total cost of ownership despite its higher purchase price.
This perspective fundamentally changes procurement philosophy. Instead of asking, “Which server costs less today?” organizations begin asking, “Which infrastructure reduces operational risk over the next five years?” That subtle shift frequently leads to better purchasing decisions because reliability becomes an investment criterion alongside performance, scalability, and cost.
Comparing the Mean Time Metrics That Matter Most
The following comparison illustrates how each metric contributes a unique perspective while supporting a common objective: building infrastructure that becomes progressively more dependable over time.
| Metric | Primary Question Answered | Business Value | Executive Insight |
|---|---|---|---|
| MTBF | How long does equipment operate before another repairable failure occurs? | Indicates hardware stability and operational consistency. | Supports lifecycle planning and vendor evaluation. |
| MTTR | How quickly is service fully restored after failure? | Measures operational efficiency and incident response maturity. | Identifies process improvements that reduce downtime costs. |
| MTTF | How long do non-repairable components typically operate before replacement? | Improves lifecycle forecasting and capital budgeting. | Enables proactive procurement and replacement planning. |
| MTTA | How rapidly are incidents recognized and acknowledged? | Measures monitoring effectiveness and operational awareness. | Reveals whether issues are identified before business impact escalates. |
Viewed individually, each metric contributes valuable operational information. Viewed together, they provide something considerably more powerful: a comprehensive framework for evaluating infrastructure reliability from technical, financial, and executive perspectives simultaneously. Rather than treating outages as isolated events, organizations begin understanding how infrastructure behaves over time, why failures occur, where operational improvements generate the greatest return, and which investments genuinely strengthen business resilience.
This broader perspective sets the stage for the next phase of reliability management. Collecting metrics is only the beginning. The real value emerges when organizations integrate those measurements into executive dashboards, capacity planning, budgeting, lifecycle management, procurement standards, and continuous operational improvement.
Building an Executive Reliability Framework That Drives Better Business Decisions
By the time an organization has established meaningful MTBF, MTTR, MTTF, and MTTA measurements, it has accomplished something many companies never do; it has begun collecting objective evidence instead of relying upon assumptions. Yet measurements alone rarely improve reliability. Dashboards do not prevent outages, spreadsheets do not reduce repair times, and executive reports certainly do not replace disciplined operational processes. Metrics become valuable only when they begin influencing decisions across engineering, finance, procurement, operations, and executive leadership. In other words, the greatest return on reliability metrics comes not from calculating them accurately, but from using them consistently to guide infrastructure strategy.
This represents a significant evolution for most organizations. Traditionally, infrastructure reporting has focused on explaining yesterday’s performance. Monthly reports describe outages, summarize maintenance windows, count support tickets, and calculate uptime percentages. While useful, those reports are inherently retrospective. Mature reliability programs, however, focus increasingly on predicting tomorrow’s operational behavior. Instead of asking, “How did we perform last month?” leadership begins asking, “What trends are developing today that could affect our business six months from now?” Mean time metrics answer precisely those kinds of questions because they expose gradual operational changes long before they become visible through customer complaints or revenue-impacting outages.
Consider an enterprise operating several hundred production servers distributed across multiple data centers. Individually, a declining MTBF for one storage cluster may appear insignificant. Viewed across eighteen months, however, similar declines occurring in multiple hardware platforms may indicate broader lifecycle issues, firmware inconsistencies, environmental concerns, or procurement decisions that deserve immediate attention. Likewise, a slowly increasing MTTR may initially seem harmless until executive leadership realizes that incident recovery now requires thirty percent more engineering effort than it did the previous year. Those trends rarely emerge overnight. They develop gradually, making them difficult to recognize without disciplined reliability reporting that emphasizes long-term movement rather than isolated monthly statistics.
For this reason, organizations benefiting most from infrastructure reliability metrics rarely limit reporting to engineering teams alone. Executive dashboards increasingly include carefully selected operational indicators alongside financial performance, cybersecurity posture, regulatory compliance, customer satisfaction, and strategic initiatives. When reliability becomes visible at the executive level, infrastructure discussions change dramatically. Hardware refresh projects become easier to justify because declining MTBF demonstrates measurable operational deterioration. Investments in automation receive stronger support because improving MTTR illustrates tangible business value. Staffing requests become supported by objective evidence when increasing MTTA reflects growing response workloads rather than anecdotal claims that engineers simply feel overwhelmed.
Designing Reliability Dashboards That Executives Actually Use
One of the more common mistakes organizations make involves overwhelming leadership with excessive technical detail. Infrastructure teams naturally appreciate granular performance statistics because those measurements assist troubleshooting and capacity planning. Executive leadership, however, typically requires a different perspective. Their objective is not understanding every hardware event but determining whether operational risk is increasing or decreasing over time. Effective reliability dashboards therefore emphasize trends, relationships, and business implications rather than individual technical incidents.
An executive reliability dashboard should answer questions that directly influence organizational planning. Is infrastructure becoming more dependable each quarter? Which business services generate the greatest operational risk? Are hardware investments producing measurable improvements in reliability? Which data centers consistently outperform others? Are incident response procedures becoming more efficient as automation expands? Most importantly, where should the organization invest next to achieve the greatest reduction in business risk? These are strategic questions, and they require strategic measurements rather than operational minutiae.
Successful dashboards also avoid presenting metrics without context. Reporting an MTTR of forty-three minutes provides little value unless leadership understands whether that represents improvement, deterioration, or expected performance. Historical trend lines, target objectives, industry benchmarks where appropriate, and explanatory commentary transform raw measurements into actionable business intelligence. Executives seldom need hundreds of statistics; they need confidence that infrastructure continues supporting organizational objectives while operational risk remains under control.
Visualization also matters, although perhaps not in the way many assume. Simplicity often proves more valuable than elaborate graphics. Clear trend indicators, concise narrative summaries, and meaningful comparisons frequently communicate infrastructure health more effectively than complex dashboards filled with dozens of unrelated charts. Reliability reporting should encourage informed decisions rather than require executives to interpret technical data independently.
Reliability Metrics as the Foundation for Capacity Planning
Capacity planning traditionally focuses on processor utilization, storage consumption, memory allocation, and network bandwidth. Those measurements remain essential, but they tell only part of the story. Infrastructure may possess abundant computing resources while simultaneously becoming less reliable due to aging hardware, increasing repair complexity, or declining operational efficiency. Capacity without reliability creates only the illusion of preparedness.
This relationship becomes especially important during periods of rapid business growth. Organizations frequently purchase additional hardware because utilization percentages suggest expanding demand. Yet if reliability metrics reveal declining MTBF across existing infrastructure or steadily increasing MTTR caused by operational complexity, simply adding more servers may compound rather than solve the underlying problem. Growth magnifies both strengths and weaknesses. Infrastructure that is operationally inconsistent at fifty servers often becomes significantly more difficult to manage at five hundred.
Reliability measurements therefore introduce an additional dimension into capacity planning. Instead of asking only whether sufficient computing resources exist, organizations begin evaluating whether those resources can continue operating dependably as workloads expand. Procurement decisions become aligned not merely with performance forecasts but with operational sustainability. This philosophy aligns closely with our article How to Design Infrastructure for Five Years of Business Growth, where infrastructure planning extends beyond immediate capacity requirements toward long-term organizational resilience.
An interesting pattern often emerges as organizations mature. Early infrastructure investments typically emphasize maximizing available computing power within limited budgets. Over time, however, leadership begins recognizing that predictable operational performance frequently delivers greater business value than simply increasing processor counts or storage capacity. A stable environment operating at moderate utilization often outperforms a highly optimized environment requiring constant intervention because predictable operations reduce business disruption, simplify planning, and allow engineering teams to focus on innovation rather than continual maintenance.
Using Reliability Metrics to Strengthen Budget Requests
Technology leaders have long struggled with one recurring challenge: explaining infrastructure investments in terms that resonate with executive leadership and finance departments. Requests for new hardware, additional staffing, improved monitoring platforms, or enhanced automation often compete with numerous other organizational priorities. Simply stating that existing equipment is becoming older or that engineering workloads are increasing rarely provides sufficient justification for significant capital expenditures.
Mean time metrics fundamentally improve these conversations because they replace subjective observations with measurable operational evidence. Rather than arguing that storage infrastructure “seems less reliable,” engineering leadership can demonstrate that MTBF has declined steadily over three consecutive reporting periods while MTTR has increased due to component availability issues. Instead of requesting additional monitoring software because existing tools appear inadequate, operations managers can illustrate that improving MTTA by only five minutes would significantly reduce downstream repair times and corresponding business disruption.
Finance professionals generally respond favorably to measurable trends because those trends support objective investment analysis. Reliability metrics establish clear relationships between infrastructure spending and operational outcomes. If a hardware refresh improves MTBF by forty percent while simultaneously reducing emergency maintenance costs, the investment becomes considerably easier to evaluate. Likewise, if automation initiatives consistently reduce MTTR, executive leadership gains confidence that future operational investments will likely produce similar measurable benefits.
Perhaps most importantly, reliability metrics shift budget discussions away from technology and toward business continuity. Organizations no longer invest merely to replace aging servers. They invest to reduce operational risk, improve customer experience, protect revenue, strengthen regulatory compliance, and support sustainable business growth. Those objectives resonate far more effectively within executive planning sessions because they align infrastructure strategy with organizational priorities rather than technical preferences.
Reliability Engineering as a Continuous Improvement Discipline
The highest-performing infrastructure organizations rarely describe reliability as a destination because operational excellence continually evolves alongside technology itself. New hardware platforms introduce different maintenance requirements. Virtualization technologies reshape operational workflows. Artificial intelligence workloads create entirely new infrastructure demands. Cybersecurity threats evolve continuously, influencing patch management, monitoring practices, and recovery procedures. Consequently, reliability engineering must remain an ongoing discipline rather than a one-time project completed after implementing a new monitoring platform or replacing aging servers.
Successful organizations therefore establish regular reliability reviews that extend beyond incident analysis. Quarterly trend evaluations examine whether MTBF continues improving, whether MTTR reflects increasing operational efficiency, whether MTTA supports organizational response objectives, and whether procurement decisions consistently strengthen long-term infrastructure resilience. These discussions frequently involve engineering, finance, procurement, security, and executive leadership because operational reliability ultimately affects every business function relying upon technology.
Another distinguishing characteristic of mature reliability programs is their willingness to learn from success as carefully as they learn from failure. Rapid recoveries deserve examination alongside prolonged outages because understanding why an incident was resolved efficiently often reveals operational practices worth standardizing across the organization. Documentation, automation, standardized hardware platforms, effective vendor relationships, and well-rehearsed operational procedures frequently emerge as recurring contributors to consistently favorable reliability metrics.
Over time, organizations embracing this philosophy develop infrastructure environments that become progressively easier to manage despite increasing complexity. Operational confidence grows because leadership understands not only current performance but also the underlying trends shaping future reliability. Engineering teams spend less time reacting to emergencies and more time improving systems. Procurement decisions become supported by measurable operational evidence. Budget planning becomes increasingly predictable. Reliability, once viewed primarily as an engineering concern, gradually becomes an organizational capability that strengthens every aspect of business performance.
This progression naturally leads to the final portion of our discussion, where we will examine how organizations can establish a practical reliability maturity model, avoid common implementation pitfalls, answer frequently asked executive questions, and ultimately transform mean time metrics from technical measurements into one of the most valuable strategic management tools available to modern infrastructure leadership.
Turning Every Incident into an Opportunity for Operational Improvement
One of the defining characteristics of mature infrastructure organizations is that they refuse to let outages become isolated events that disappear into historical ticket archives. Every significant incident becomes an opportunity to improve operational processes, validate existing assumptions, and strengthen long-term reliability. Unfortunately, many organizations unintentionally stop their investigation once service has been restored. Systems return to production, customers regain access, support tickets are closed, and engineering teams move on to the next priority. While understandable in busy environments, this approach leaves tremendous value unrealized because the most important lessons often emerge after the immediate crisis has passed.
Reliability metrics fundamentally change the purpose of post-incident reviews. Rather than asking only what failed, organizations begin asking why operational measurements behaved as they did throughout the entire incident lifecycle. Was MTTA longer than expected because monitoring thresholds generated excessive alert noise? Did MTTR increase because replacement hardware was unavailable locally? Did recurring failures indicate that MTBF had been declining for months without anyone recognizing the trend? Was documentation sufficiently detailed to support rapid recovery, or did engineers rely upon institutional knowledge possessed by only one or two senior staff members? These questions move root cause analysis beyond technical troubleshooting and toward operational improvement.
This broader perspective often produces improvements extending well beyond the affected system itself. An incident involving storage hardware may expose weaknesses in inventory management. A networking failure might reveal inconsistent firmware governance across multiple facilities. A prolonged recovery effort may demonstrate that documentation standards vary significantly between engineering teams. Each discovery presents an opportunity to strengthen operational maturity across the entire infrastructure rather than correcting only the immediate technical fault.
Organizations adopting this philosophy gradually build an institutional memory that becomes increasingly valuable over time. Every incident contributes measurable intelligence that influences future architecture decisions, procurement standards, lifecycle planning, staffing models, monitoring strategies, and operational procedures. Reliability therefore becomes cumulative. Each outage, while undesirable, strengthens the organization’s ability to prevent or recover from the next one.
Benchmarking Reliability Across Infrastructure Environments
As enterprise infrastructure expands into multiple geographic locations, comparing operational performance between environments becomes increasingly valuable. Many organizations already compare utilization statistics, bandwidth consumption, and resource allocation between facilities. Far fewer consistently compare mean time metrics, even though those measurements frequently reveal operational differences that utilization statistics never expose.
Imagine an organization operating production infrastructure in Dallas, Los Angeles, New York, and a disaster recovery environment elsewhere. Processor utilization may remain remarkably similar across all locations, yet MTTR in one facility consistently exceeds the others. At first glance, the disparity may appear insignificant. Closer examination, however, might reveal slower spare part availability, inconsistent engineering procedures, different hardware generations, varying documentation quality, or less mature monitoring practices. Without standardized reliability measurements, these operational inconsistencies often remain hidden until a significant outage forces leadership to investigate.
Benchmarking should not be viewed as a mechanism for ranking engineering teams against one another. Instead, its purpose is to identify operational practices producing superior results so those practices can be adopted elsewhere. If one facility consistently demonstrates shorter MTTA because of improved alert correlation, those monitoring strategies deserve broader implementation. If another location achieves higher MTBF through stricter firmware management or standardized hardware procurement, those practices become candidates for enterprise-wide adoption. Reliability benchmarking therefore encourages collaboration rather than competition because the objective is organizational improvement rather than departmental comparison.
This concept also applies internally within large environments. Virtualization clusters, storage platforms, GPU compute environments, and customer-facing production systems each generate unique operational characteristics. Comparing reliability metrics across these environments frequently reveals opportunities for standardization, automation, or infrastructure redesign that would otherwise remain difficult to identify.
Predictive Infrastructure Management Begins with Reliability Trends
Perhaps the greatest long-term value of mean time metrics lies in their ability to support predictive decision-making. Traditional infrastructure management is inherently reactive. Components fail, engineers respond, repairs are completed, and operations resume. Although this approach remains necessary for unexpected events, mature organizations increasingly supplement reactive support with predictive maintenance informed by measurable operational trends.
Declining MTBF offers an excellent example. A gradual reduction occurring across a particular hardware platform rarely represents coincidence. More often, it signals aging components, increasing workload demands, firmware instability, environmental influences, or manufacturing characteristics becoming more apparent over time. Waiting until those trends produce widespread failures usually results in emergency procurement, unplanned maintenance windows, and elevated business risk. Responding while the trend remains manageable allows organizations to schedule replacements strategically, negotiate procurement more effectively, and minimize customer disruption.
Similarly, increasing MTTR may indicate far more than declining engineering performance. Growing repair times sometimes reflect expanding infrastructure complexity, inconsistent documentation, reduced spare part inventories, or operational procedures that have not evolved alongside business growth. By recognizing these gradual shifts early, leadership can address underlying causes before recovery efficiency deteriorates enough to affect service availability.
Predictive infrastructure management therefore depends less upon forecasting the exact moment a component will fail and more upon recognizing patterns indicating that operational conditions are changing. Mean time metrics provide precisely that visibility. They transform thousands of individual events into long-term trends capable of guiding strategic planning months or even years before major reliability concerns emerge.
Standardization: The Quiet Force Behind Better Reliability Metrics
Throughout many of our previous discussions, one principle has surfaced repeatedly because it influences nearly every aspect of enterprise infrastructure: standardization. Organizations frequently pursue standardization to simplify procurement, reduce deployment complexity, or improve operational consistency. Less frequently discussed is its profound influence on reliability metrics themselves.
Standardized infrastructure almost always produces better MTTR because engineers become deeply familiar with consistent hardware platforms, firmware versions, operating systems, monitoring configurations, and recovery procedures. Troubleshooting accelerates because operational variables decrease. Documentation becomes easier to maintain because fewer configuration differences require explanation. Spare part inventories shrink while simultaneously becoming more effective because interchangeable components support multiple production environments. Even vendor relationships often improve because standardized environments simplify warranty support and technical escalation.
The same principle influences MTBF. Standardized qualification procedures reduce the likelihood of introducing untested hardware combinations or inconsistent firmware revisions into production. Operational experience accumulates around known configurations, allowing engineering teams to identify subtle performance characteristics that might otherwise remain unnoticed across highly diverse environments. Reliability improves not because standardized hardware is inherently superior, but because standardized operations reduce unnecessary complexity.
This relationship reinforces the importance of disciplined infrastructure governance, a topic explored extensively in our article How to Build a Server Standardization Strategy That Reduces Cost Without Limiting Growth. Standardization should never be viewed merely as an administrative exercise. It is one of the most effective long-term strategies for improving nearly every reliability metric discussed throughout this article.
Quantifying the Financial Return of Reliability
Although infrastructure professionals naturally appreciate improved reliability from a technical perspective, executive leadership ultimately evaluates investments through financial outcomes. Fortunately, reliability metrics translate remarkably well into measurable business value because nearly every improvement reduces costs while simultaneously strengthening operational resilience.
Higher MTBF reduces emergency maintenance frequency, lowering overtime expenses and minimizing disruptions to planned engineering initiatives. Improved MTTR decreases downtime duration, protecting revenue while preserving customer confidence. Faster MTTA reduces the likelihood that minor incidents escalate into widespread service interruptions requiring substantially greater recovery effort. Longer MTTF enables more predictable lifecycle planning, allowing procurement departments to negotiate purchases strategically rather than responding under emergency conditions.
These operational improvements also create secondary financial benefits that are sometimes overlooked during budgeting discussions. Customer support volumes often decline because infrastructure behaves more predictably. Change management becomes less disruptive because engineering teams spend less time recovering from unexpected failures. Forecasting improves because replacement schedules become driven by measurable operational evidence rather than assumptions. Even employee retention may benefit, as engineers generally prefer working within stable, well-managed environments rather than continually responding to preventable emergencies.
Perhaps most importantly, reliable infrastructure creates organizational confidence. Executives gain greater assurance when approving expansion initiatives because operational performance demonstrates sustained stability. Finance departments become more comfortable funding long-term infrastructure investments because measurable reliability improvements validate previous spending decisions. Customers develop greater trust because consistent service delivery strengthens business relationships over time. These outcomes are admittedly more difficult to express numerically, yet they frequently represent some of the most valuable returns reliability engineering can deliver.
By this stage, a comprehensive reliability framework has begun to emerge. Mean time metrics no longer function merely as operational statistics collected for monthly reports. They become strategic indicators supporting procurement, budgeting, lifecycle management, executive planning, continuous improvement, and long-term business growth.
Infrastructure Reliability Maturity Model
Every organization measures infrastructure performance in some fashion, but not every organization measures it with the same purpose. Some collect statistics simply because monitoring platforms generate them automatically. Others review reports after an outage has already disrupted business operations. The organizations that consistently deliver dependable service, however, gradually progress through recognizable stages of operational maturity where mean time metrics evolve from passive statistics into strategic management tools. Understanding where an organization currently resides within this maturity model often provides as much value as the metrics themselves because it highlights the next logical area for improvement rather than attempting to solve every operational challenge simultaneously.
At the earliest stage, reliability management remains almost entirely reactive. Failures are addressed as they occur, documentation is inconsistent, and success is often measured by the dedication of experienced engineers willing to work long hours during emergencies. Mean time metrics may exist within monitoring software, but they receive little executive attention and rarely influence budgeting, procurement, or lifecycle planning. Infrastructure continues operating, yet operational stability depends heavily upon individual knowledge rather than repeatable processes.
As organizations mature, they begin collecting and reviewing MTBF, MTTR, MTTF, and MTTA consistently across production environments. Reporting becomes standardized, trends receive greater attention than isolated incidents, and engineering teams develop measurable improvement objectives rather than simply reacting to outages. At this stage, leadership starts recognizing patterns that would previously have gone unnoticed, allowing maintenance priorities and hardware refresh decisions to become increasingly evidence-based.
The next level of maturity integrates reliability directly into business planning. Procurement standards reference historical reliability data alongside technical specifications. Budget requests include measurable operational justification supported by long-term trends. Executive dashboards monitor infrastructure reliability alongside financial and operational KPIs. Standardization initiatives, automation projects, and documentation improvements are evaluated according to their measurable influence on reliability metrics rather than their perceived technical elegance.
Highly mature organizations move beyond observation into prediction. Declining MTBF triggers planned replacement activities months before widespread failures occur. Increasing MTTR prompts reviews of documentation, staffing, monitoring, or operational workflows before customer experience deteriorates. Reliability engineering becomes proactive rather than reactive because trends identify emerging concerns while they remain relatively inexpensive to address.
The highest level of maturity treats infrastructure reliability as a strategic business capability. Executive leadership understands the operational implications of every major metric. Finance departments incorporate reliability trends into long-term capital planning. Procurement evaluates vendors using measurable operational performance. Engineering teams continuously refine processes through disciplined post-incident analysis, while customers benefit from infrastructure that quietly performs its role without unnecessary drama. Ironically, the greatest compliment such organizations often receive is that customers rarely think about the infrastructure at all.
Frequently Asked Questions
Is MTBF the single most important reliability metric?
Not really, although it is certainly one of the most recognized. MTBF measures how frequently repairable failures occur, but it cannot explain how efficiently your organization responds once those failures happen. An environment with an excellent MTBF may still deliver poor customer experiences if incident response remains slow or operational procedures are inconsistent. The greatest value comes from evaluating MTBF alongside MTTR, MTTA, and MTTF, allowing leadership to understand both equipment reliability and operational effectiveness.
Can smaller organizations benefit from mean time metrics?
Absolutely. While large enterprises often formalize reliability engineering programs, smaller organizations frequently realize meaningful improvements even by tracking a handful of carefully selected metrics. A company operating twenty servers can identify recurring hardware issues, improve documentation, strengthen monitoring, and make better procurement decisions using exactly the same principles employed by organizations managing thousands of production systems. The scale differs; the methodology does not.
How often should reliability metrics be reviewed?
Monthly reporting provides a useful operational rhythm for most organizations, but quarterly trend analysis generally offers greater strategic value because it minimizes short-term fluctuations while revealing meaningful long-term movement. Significant deviations should certainly receive immediate attention, yet infrastructure reliability is best understood through sustained trends rather than isolated reporting periods.
Should executive leadership review these metrics directly?
Yes, although the presentation should differ from engineering dashboards. Executives generally benefit from trend analysis, business implications, and strategic recommendations rather than detailed technical statistics. Reliability reporting should answer whether operational risk is increasing or decreasing, where investment produces measurable improvement, and how infrastructure performance supports organizational objectives.
How do reliability metrics influence hardware replacement?
Organizations relying solely upon equipment age often replace hardware either too early or too late. Incorporating MTBF and MTTF into lifecycle planning provides objective evidence supporting replacement decisions. Instead of following arbitrary refresh schedules, infrastructure investments become aligned with measurable operational performance, reducing unnecessary spending while minimizing the likelihood of unexpected failures.
Do cloud environments eliminate the need for these measurements?
Not at all. Cloud infrastructure changes operational responsibilities but does not eliminate reliability management. Organizations still depend upon monitoring, incident response, application recovery, documentation, operational procedures, and vendor performance. In many respects, measuring reliability becomes even more important because responsibility is now shared across multiple providers and internal teams.
Can automation replace reliability engineering?
Automation dramatically improves consistency, particularly by reducing MTTA and MTTR, but it cannot replace disciplined operational governance. Automated systems require thoughtful design, regular testing, documentation, monitoring, and continual refinement. Automation should strengthen reliability engineering rather than become a substitute for it.
What is the biggest mistake organizations make?
Perhaps the most common mistake is treating reliability metrics as historical reports instead of management tools. Measurements should influence budgeting, procurement, staffing, standardization, documentation, monitoring, and long-term planning. If dashboards merely explain yesterday’s outages without changing tomorrow’s decisions, much of their strategic value remains unrealized.
Executive Conclusion
Modern infrastructure has reached a level of complexity where traditional availability reporting no longer provides sufficient insight for executive decision-making. Uptime percentages remain valuable, but they represent only the visible outcome of countless operational processes occurring behind the scenes. Hardware quality, monitoring maturity, documentation standards, engineering readiness, lifecycle planning, procurement discipline, vendor relationships, automation, and organizational governance collectively determine whether infrastructure continues supporting the business reliably year after year.
That reality explains why mean time metrics have become indispensable. They provide objective evidence describing not only how infrastructure performs today but how it is likely to perform tomorrow. MTBF reveals operational stability. MTTR measures recovery capability. MTTF strengthens lifecycle planning. MTTA evaluates the organization’s ability to recognize developing incidents before they become widespread disruptions. Together, these measurements create a common language understood by engineering, finance, procurement, operations, and executive leadership alike.
Perhaps the most significant lesson, however, extends beyond any individual metric. Organizations that consistently outperform their competitors rarely achieve superior reliability by purchasing the most expensive hardware or implementing the newest technologies first. They succeed because they measure operational performance continuously, learn from every incident, standardize wherever practical, and allow measurable evidence (not assumptions) to guide long-term infrastructure strategy. Reliability, in those organizations, becomes a managed business capability rather than a fortunate outcome.
As digital infrastructure continues supporting increasingly critical business operations, that distinction will only become more important. Companies that invest in understanding reliability today position themselves to grow with greater confidence tomorrow, knowing that every infrastructure decision is supported by measurable operational intelligence rather than hopeful speculation.
If your organization is evaluating new infrastructure designed for long-term reliability, predictable performance, and enterprise-class operational consistency, ProlimeHost can help. Whether you’re deploying business-critical applications on our Dedicated Server Hosting platform or building AI, machine learning, rendering, and high-performance computing environments using our GPU Dedicated Servers, our team can help design infrastructure that supports both today’s operational requirements and tomorrow’s business growth.
About the Author
Steve Bloemer
Director of Sales & Operations
ProlimeHost
Phone: 877-477-9454
Steve works with organizations throughout North America to design dedicated server, storage, GPU, and enterprise infrastructure solutions that balance performance, operational reliability, scalability, and long-term business value. His focus extends beyond hardware specifications to helping organizations build infrastructure strategies that support sustainable growth while reducing operational risk.